Debugging a freaking EXC BAD ACCESS in iOS App
One of the exception that I often run into in any iOS app development is the freaking EXC BAD ACCESS. An error which is occurs due to error in memory management, e.g. accessing an object that has been release or passing an invalid pointer to a system call (delegate call).
Enough saying, so how do you trace it down and find the object that you are trying to access and cause that exception? Well there is 2 ways:
- NSZombie which is mentioned in Apple developer library's Memory Management guide
- Instrument tools to profile your app. See this article for details on this tools.
To use NSZombie class you simple add NSZombieEnabled into your project Environment Variable.
You can access the Environment Variable settings screen by clicking Product > Edit Scheme from the menu.

Expand Environment Variables section and click on the + icon. Add NSZombieEnabled into the field. (you can also add NSAutoreleaseFreedObjectCheckEnabled & NSDebugEnabled, each flags help to displaying more info during debugging a memory management problems.)

With those flags in place whenever you ran into EXC BAD ACCESS exception, the output console will show you the location / files + method call that causes the exception. You might not get the exact line number but it is better then nothing!
But do remember that these flags should not be in a production app, well at least when you compiled for production, you should uncheck the checkbox next to it.
I normally log a big message in the output if those flag is enabled during application launch (AppDelegate's didFinishLaunchingWithOptions). You can check if the environment variables exist using the following codes:
if(getenv("NSZombieEnabled")) {
    NSLog(@"*** WARNING *** NSZombieEnabled !!!");
}
So every time I run my app I'll see the message.
Apart from using the NSZombieEnabled flag in environment variable, you could also use the Instrument tool. To do this:
- Click Product > Build For > Build For Profiling
- Click Product > Profile
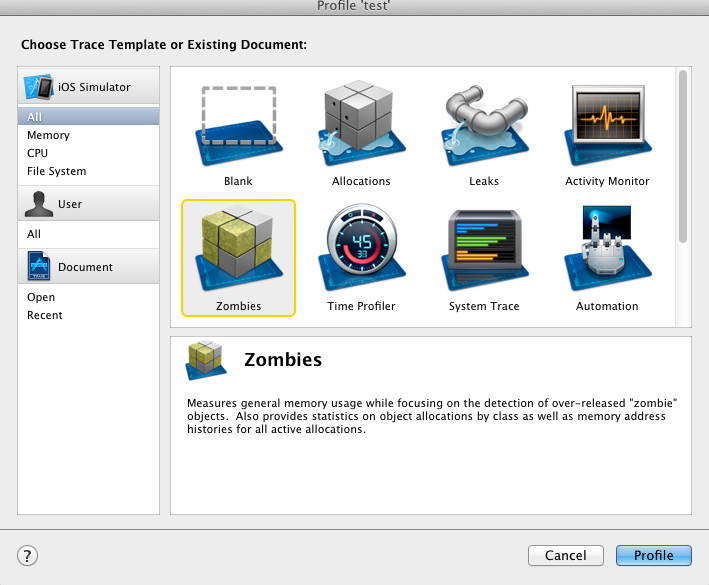
- Select All under iOS Simulator and select Zombies
- Click Profile to start the profiling
The profiling will starts automatically and you can see the full memory graph. You can now start to play with your app to trigger the EXC BAD ACCESS exception

When an exception occurs there will be a flag shown on the graph, and clicking on it will show you the Stack Track and location it was thrown.
p/s: Snapshot in this articles is showing the interfaces of Xcode 4.2


Comments
Post a Comment